The drop point is translated from viewport coordinates into clamped percentages within the rendered image.
~/jessejaffe/work/ecofi
all work
field planning + visual operations / 2026
Ecofi
I built a field-plan editor for reusable lighting symbols, drag-and-drop placement, directional connectors, and fitted PDF reports.
the problem
Google Maps kept lighting plans manual; the client needed customizable drag-and-drop software they owned.
Hand-drawn symbols drift between plans, obscure aiming direction, and require manual counting and repeated setup.
Ecofi structures each image with a reusable legend, positioned fixtures, connectors, statistics, and PDF export.
visual walkthrough
From a raw property image to a clear plan, reusable project, and printable report.
One workspace makes plans reusable, countable, and exportable.
-
01
Make the property image the working surface
Upload any property image, place structured fixtures on it, then remove editing controls in view mode.
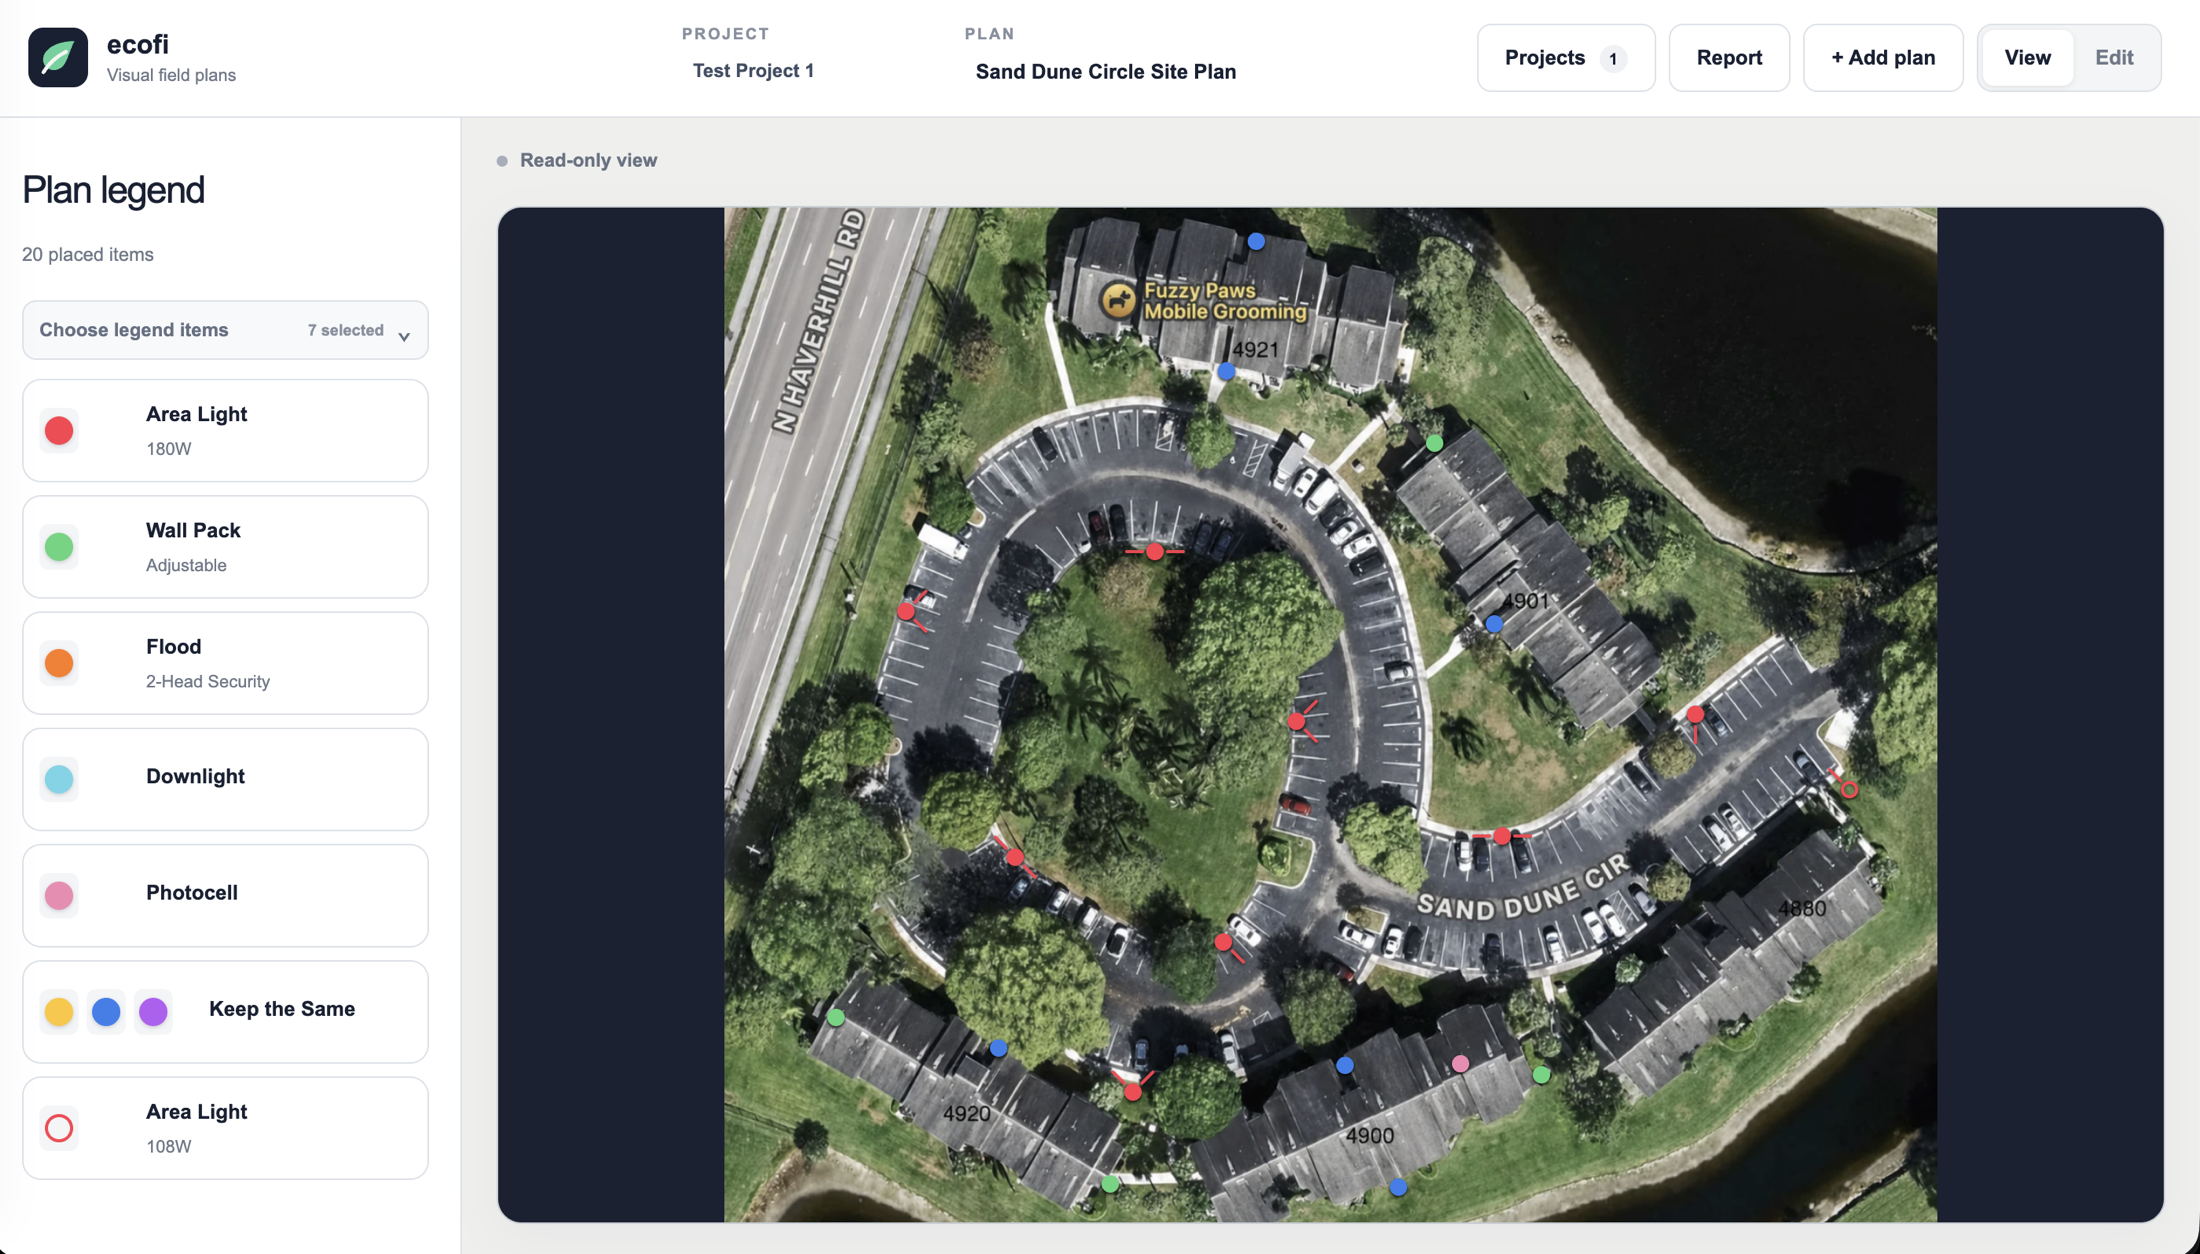
A complete visual field plan in read-only mode -
02
Define a legend that matches the job
Admins preconfigure reusable legend items with names, details, shapes, colors, and variants.
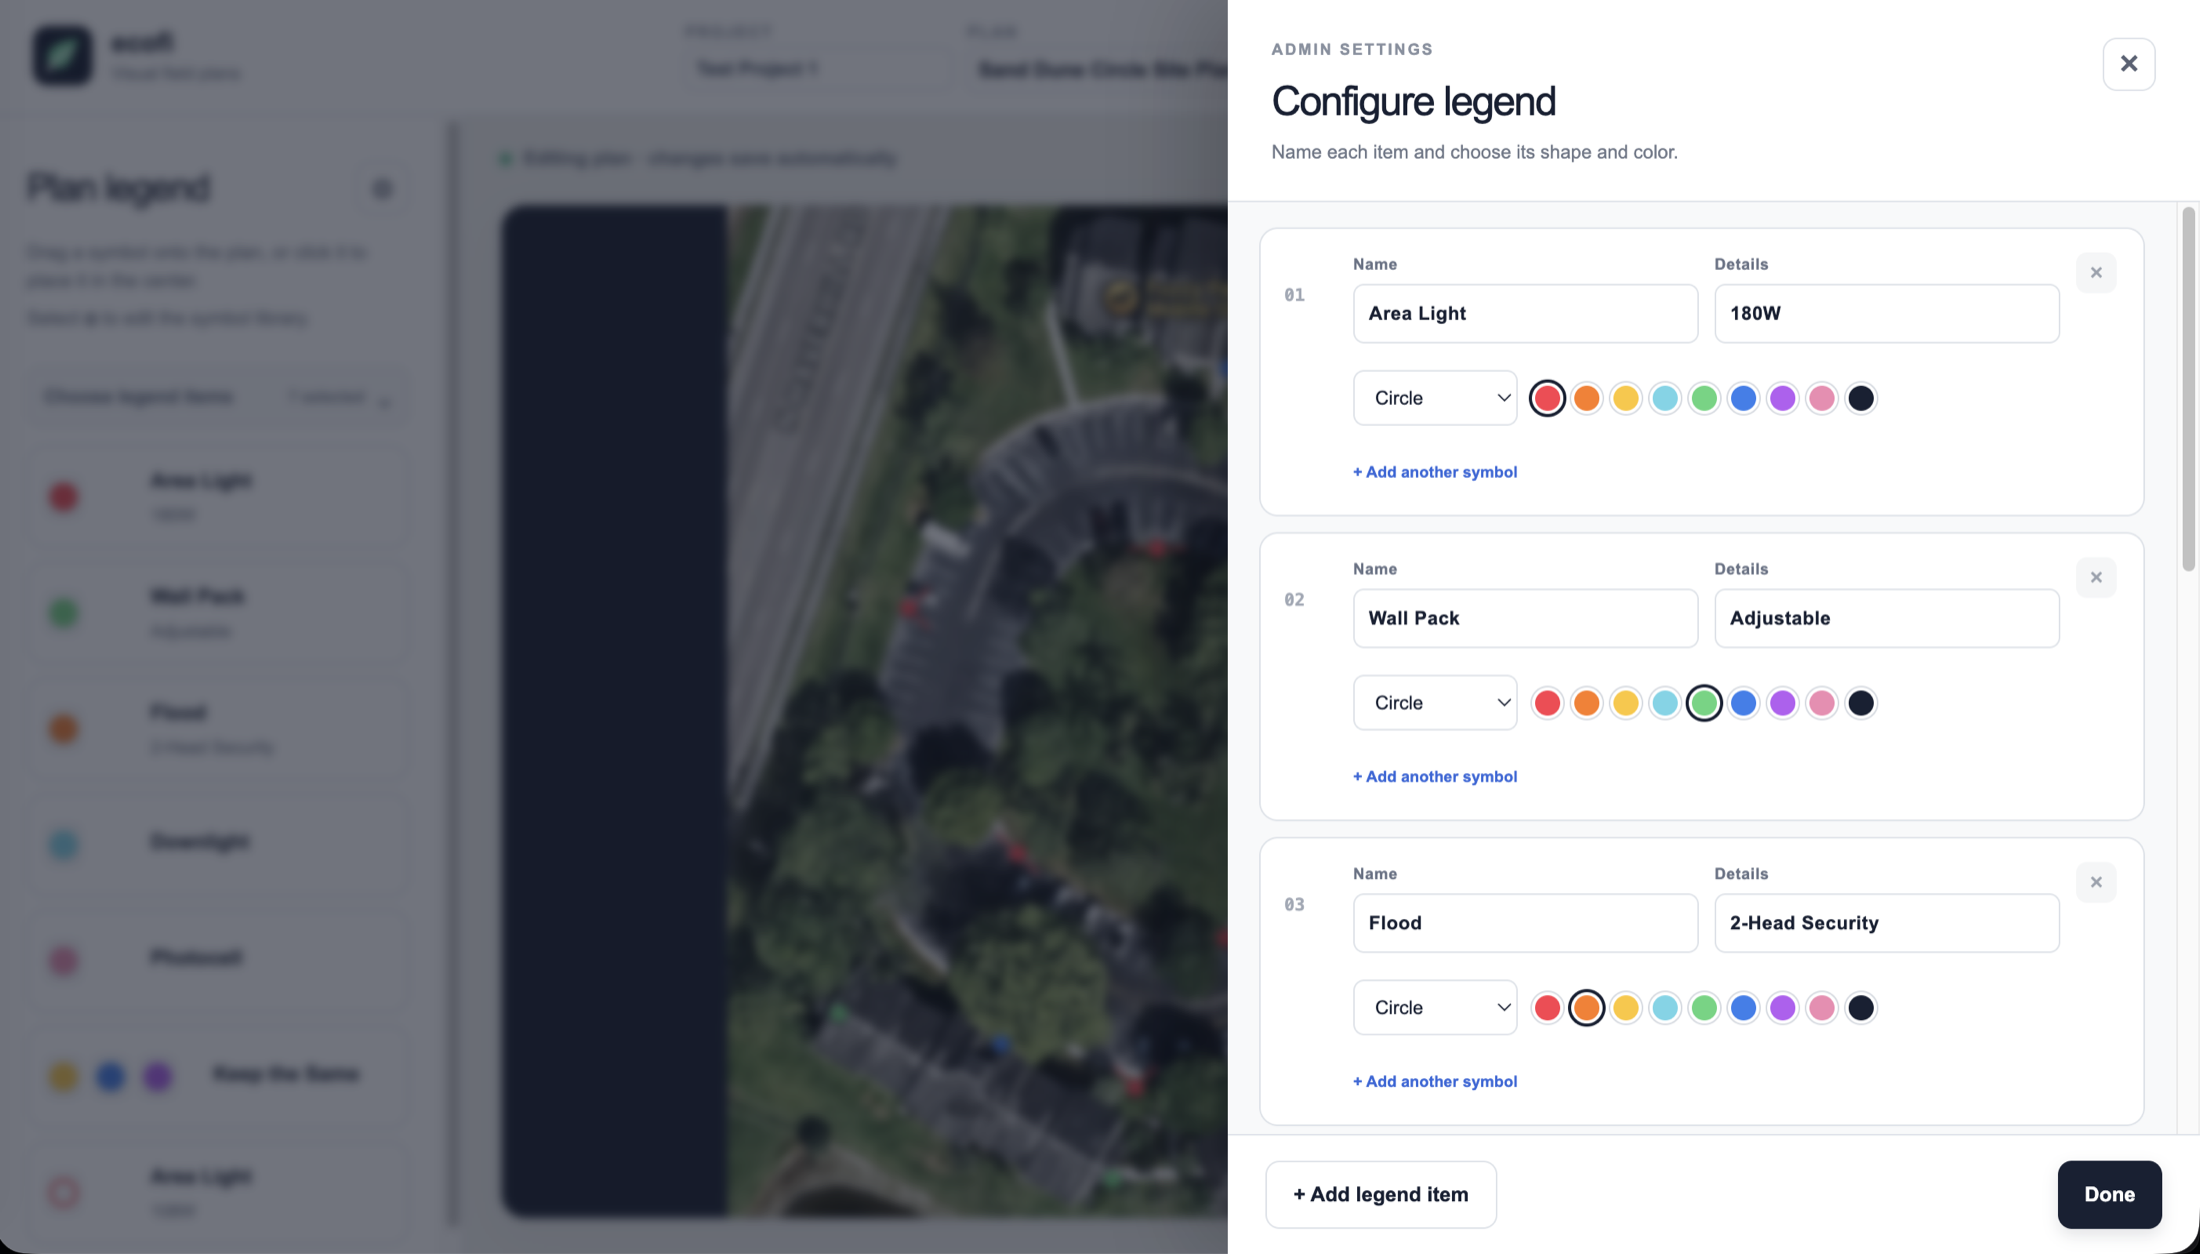
Admin-controlled legend configuration -
03
Choose what belongs on each plan
A per-plan filter controls which shared legend items appear on the canvas, in totals, and in exports.
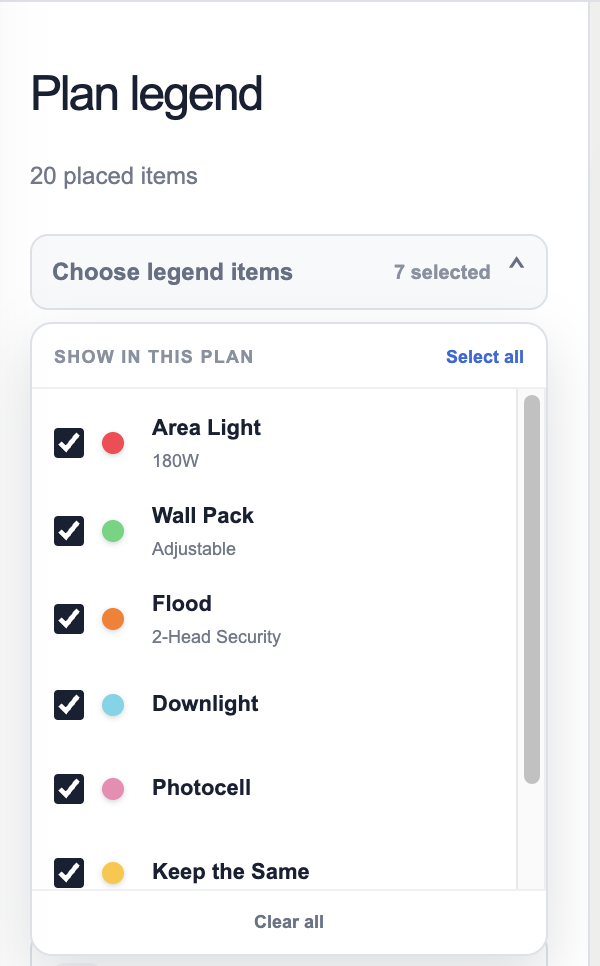
Per-plan legend visibility -
04
Place fixtures and show where they point
Drag fixtures into position and add up to eight connectors showing where each light points.
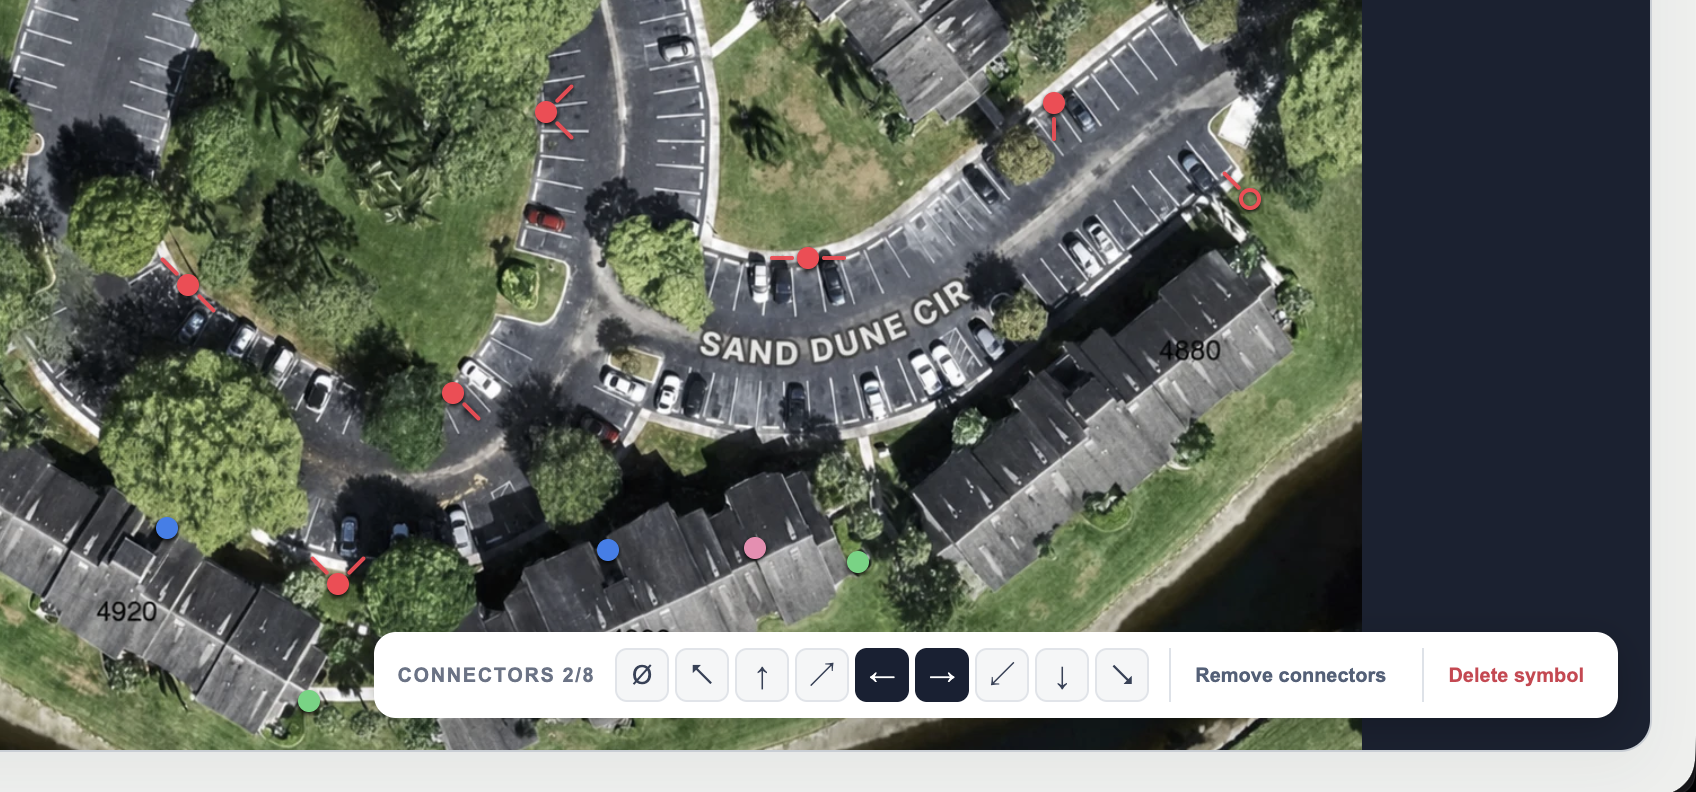
Directional connector controls on the plan -
05
Keep related plans in one reusable project
Related plans share one project's legend while keeping independent images, markers, and dates.
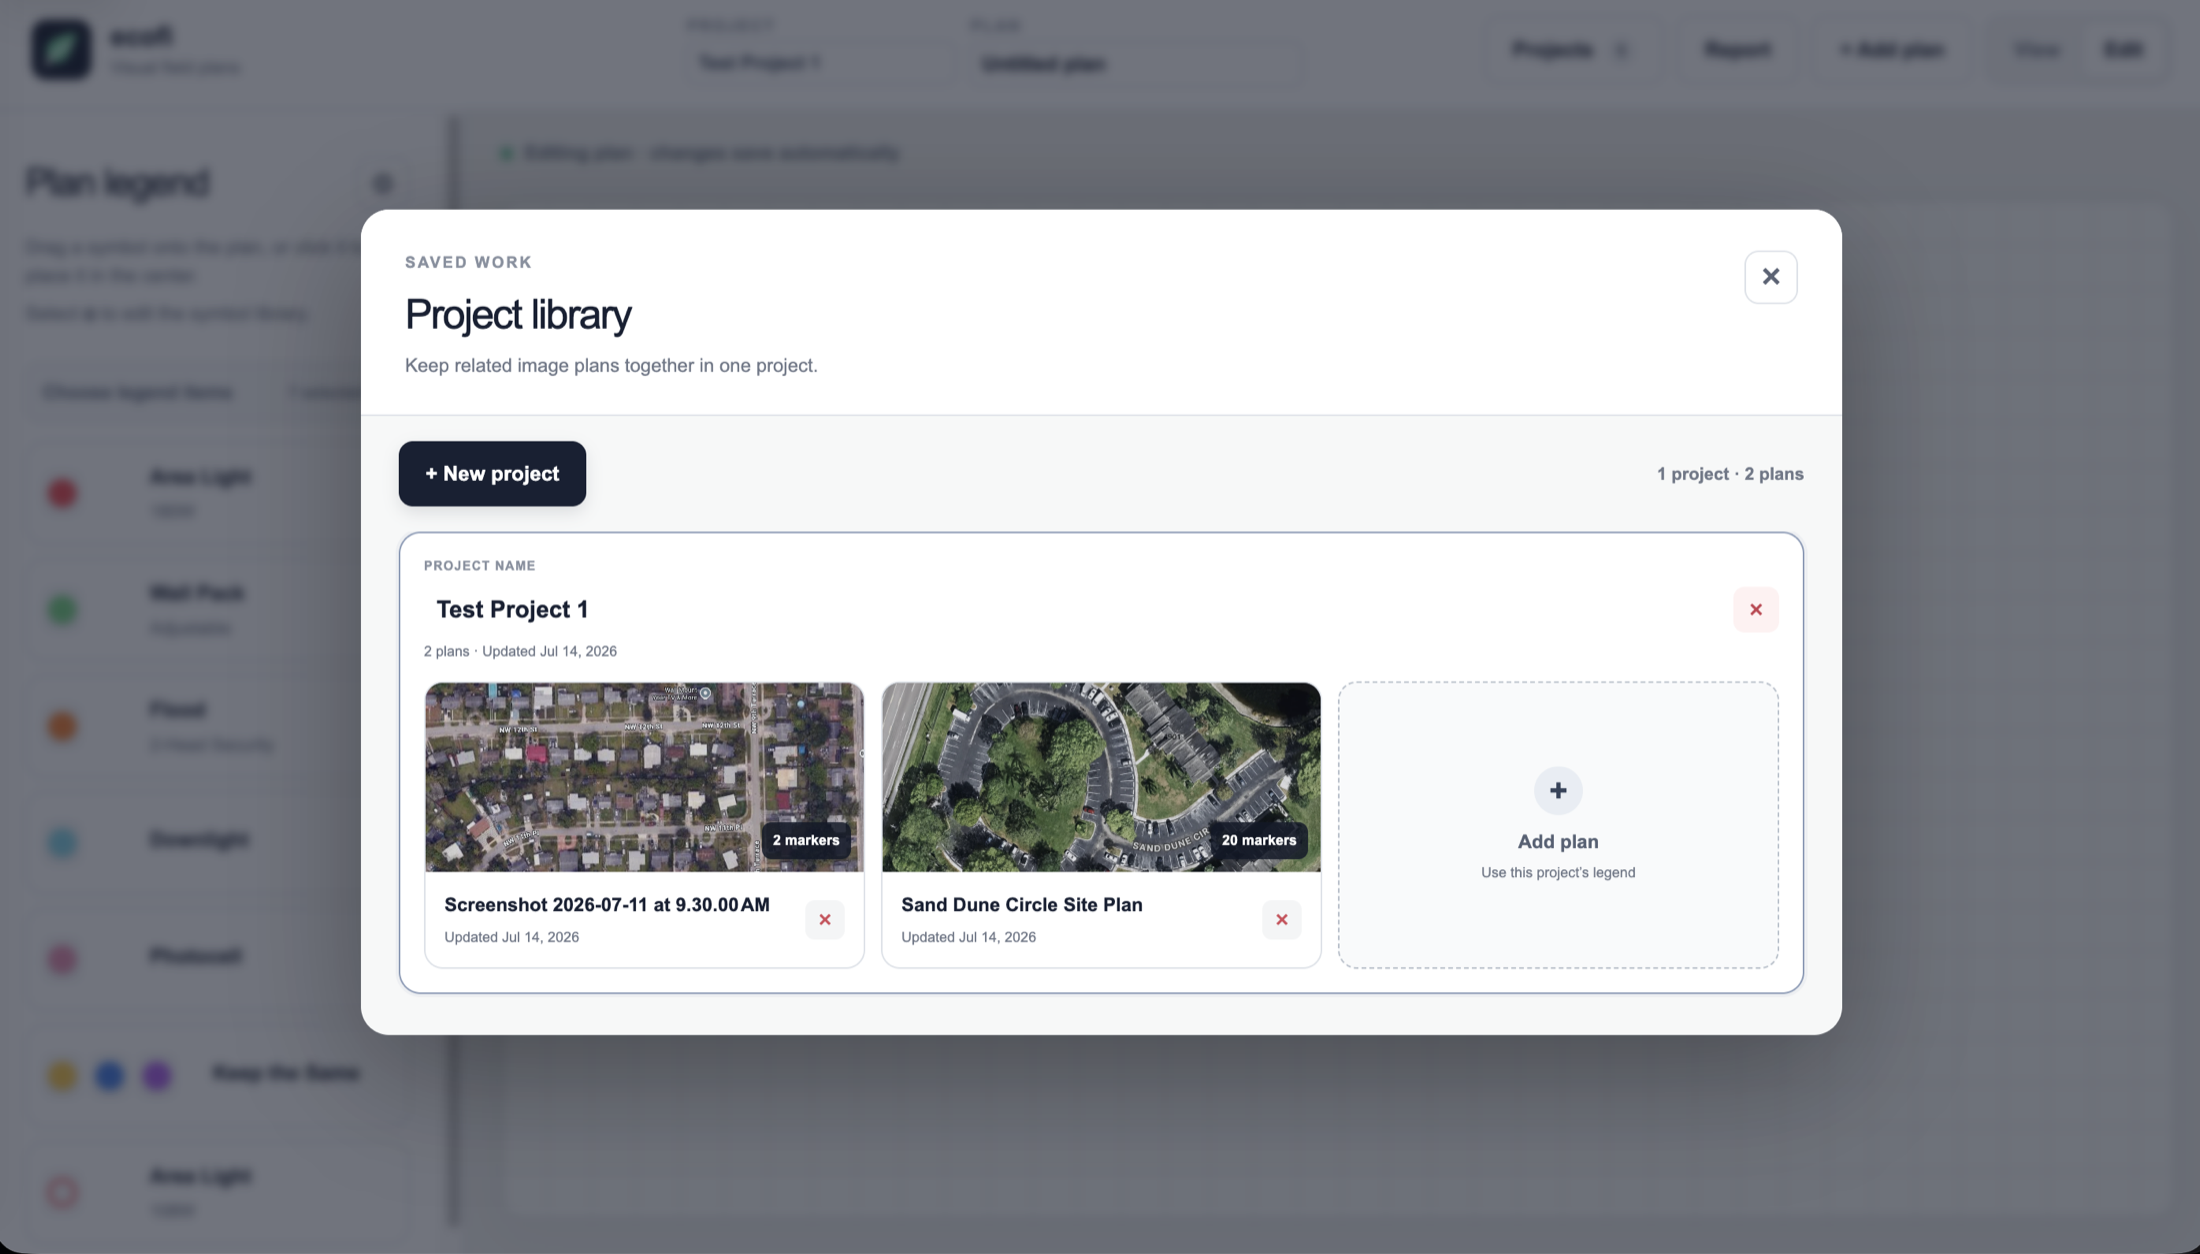
Saved projects and related plans -
06
Create counts and a field-ready PDF
Reports count symbols and connector directions, then fit each chronological plan and legend onto one PDF page.
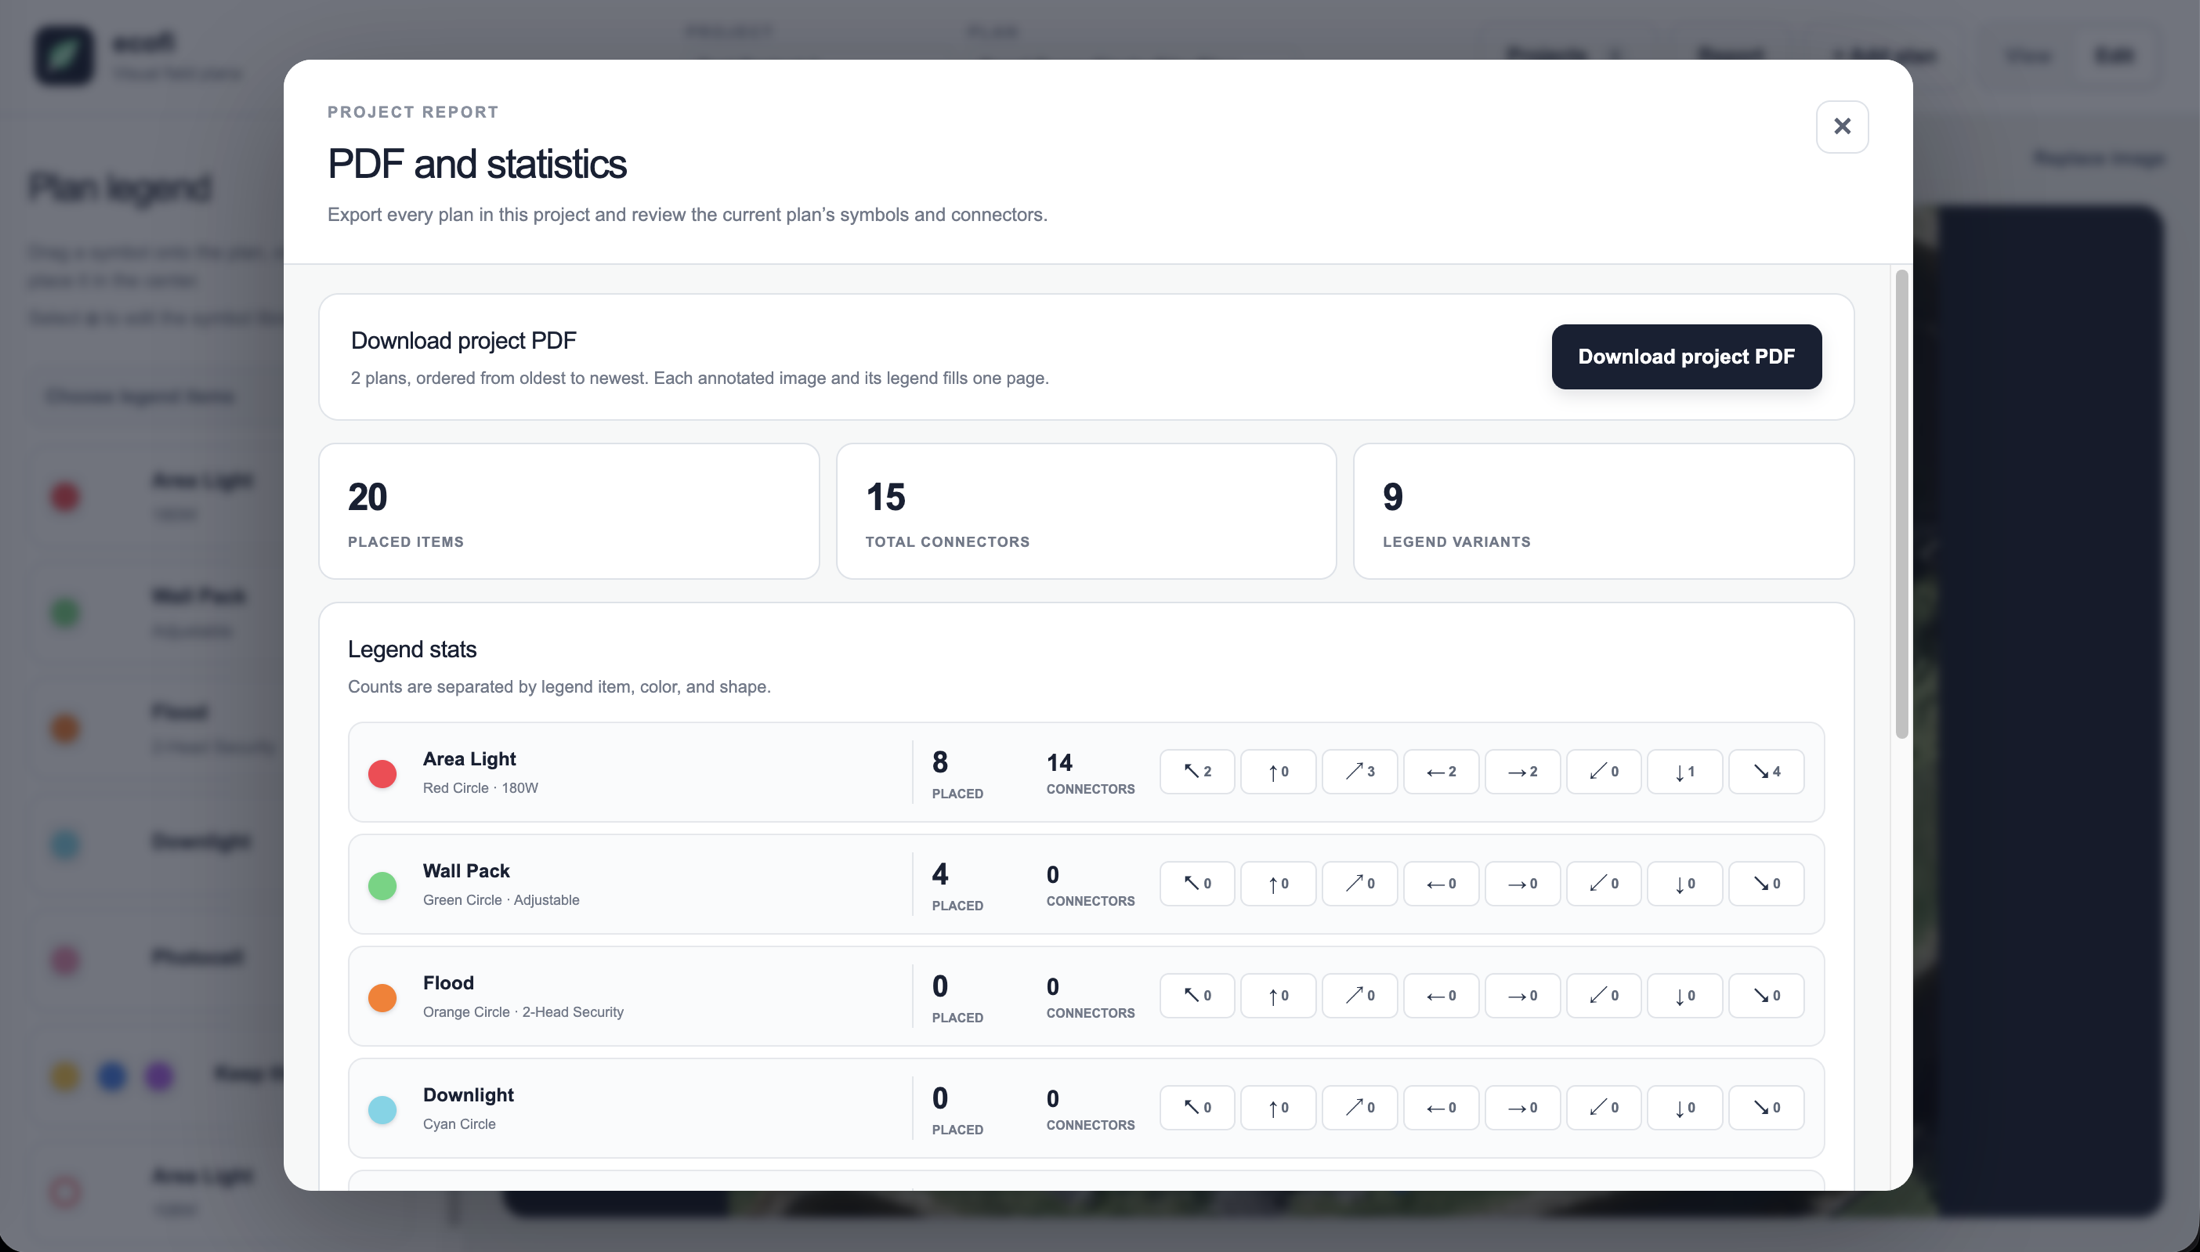
Project PDF export and current-plan statistics
technical brief
README.md
A responsive React planner built around normalized coordinates, structured legends, serialized autosaving, file-backed storage, and deterministic PDF rendering.
01 / architecture
Keep the canvas interactive and the saved model portable
The browser owns the editing experience: uploads, legend configuration, marker placement, filters, statistics, and PDF composition all run in React. The saved plan stays compact because it stores an image URL plus structured JSON rather than a flattened screenshot of the finished work.
01image intakeresize and optimize in the browser
02plan modellegend, visibility, markers + coordinates
03live editordrag, touch, connectors + view mode
04storage APIuploaded image plus atomic plan JSON
05reportstatistics plus a rebuilt PDF overlay
The frontend uses a same-origin relay for plan records and sends image bodies directly to the storage service. Large photos are resized to a maximum 2,000-pixel edge and converted to WEBP when that produces a smaller file, reducing both upload time and storage.
02 / spatial model
Store positions as percentages, not screen pixels
Every marker records horizontal and vertical position as a percentage of the displayed image artboard. The artboard itself preserves the uploaded image's natural aspect ratio inside the available canvas, so a marker at the entrance stays at the entrance across desktop, mobile, read-only mode, and PDF export.
Pointer capture keeps the marker attached to a finger or stylus even when movement leaves the small symbol target.
A resize observer fits the natural image ratio into its container while the saved coordinates remain unchanged.
Each marker can hold up to eight unique angles mapped to the cardinal and diagonal directions.
03 / legend system
Separate fixture meaning from each placed instance
A preset contains its reusable name, details, and one or more symbol definitions. A marker references the preset and the chosen variant by ID instead of copying that descriptive data. Changing an item therefore updates the legend and every relevant marker together.
project
  └─ plans[]
       ├─ image URL + created / updated time
       ├─ presets[]
       │    └─ name + details + symbol variants[]
       ├─ visiblePresetIds[]
       └─ markers[]
            └─ presetId + symbolIndex + x% + y% + angles[]
Visibility is part of the plan rather than the project-wide preset. That lets a team keep one comprehensive lighting vocabulary while narrowing individual images to the fixtures that are relevant there. The same filtered set drives the sidebar, canvas, report statistics, and PDF legend.
04 / persistence + storage
Serialize edits and save image files independently
React state updates immediately, while plan saves enter one promise queue so rapid marker movements cannot arrive at the server out of order. Snapshots prevent redundant writes, failures retry with exponential backoff, and a visible status distinguishes saving, saved, and unreachable storage.
The Node service writes a temporary per-workspace file and renames it over the current record, avoiding partially written plan libraries.
PNG, JPG, and WEBP uploads stream to disk with a 25 MB limit and immutable cache headers for completed images.
An uploaded image is removed only after the last plan that references it is deleted.
The storage API listens on localhost behind Nginx, runs under a restricted systemd account, and keeps its writable data in one directory.
05 / PDF + reporting
Rebuild the plan for print instead of capturing the interface
Export uses jsPDF to recreate every visible symbol and connector from plan data. Plans are sorted from oldest to newest, each page switches between portrait and landscape to match its image, and the legend chooses three or four columns before the image is scaled into the remaining space.
The layout measures legend rows first, then scales the image into the remaining printable area without distorting it.
Symbols and connector vectors are redrawn after the image, producing sharp consistent annotations instead of a browser screenshot.
Placed totals remain separated at the same level of detail that the planner used when choosing each symbol.
The report exposes the total number of connector lines and the directional distribution across the selected legend items.
06 / reliability
Test the rendered shell, storage lifecycle, and generated document
The automated suite builds the production application, checks the server-rendered HTML and key interaction contracts, exercises real HTTP uploads and plan deletion against a temporary data directory, and generates a multi-page PDF to verify chronological ordering and document output.
Protects the project library, legend filtering, pointer controls, reporting, and storage configuration from disappearing during a refactor.
Verifies upload, save, shared-image retention, final image deletion, and an empty persisted plan library.
Creates portrait and landscape plans, sorts them by creation time, and confirms a valid two-page PDF.
The Cloudflare-compatible frontend and the Hetzner storage service deploy independently, keeping the interactive app lightweight.
07 / stack
Built across the planning, export, and operations surface
- language
- TypeScript, JavaScript
- frontend
- React 19, Next.js 16 APIs, Tailwind CSS 4
- runtime + build
- vinext, Vite 8, Cloudflare Worker-compatible output
- interaction
- HTML drag and drop, Pointer Events, ResizeObserver, Canvas image processing
- documents
- jsPDF with programmatic symbols, connectors, legends, and page fitting
- storage
- Node.js HTTP service, JSON plan records, filesystem uploads, atomic rename
- testing
- Node test runner, rendered HTML contracts, live HTTP API fixtures, generated PDF fixtures
- operations
- Linux, Nginx, systemd, scheduled backups, Hetzner